After two years of school closures and disruptions caused by the pandemic, California administered the CAASPP/Smarter Balanced tests normally again for the first time in the spring of 2022. The state did not administer the tests in 2020, due to school closures, and districts had the option to use local assessments instead in 2021, resulting in only 743,626 students taking the Smarter Balanced tests.
This year, 2,969,670 million students in grades 3-8 and 11 took the tests. The results can help shed light on the impact of the pandemic on student learning.
How to view CAASPP test results on Ed-Data
You can now find Smarter Balanced test results in the form of trend graphs at the school, district, county and state level in the Student Profiles or go to comparisons to see the data for multiple schools or districts in one place. CAASPP data are available beginning with the 2014-15 school year, the first year the Smarter Balanced tests were administered.

Visit the Performance section in the Student Profile tab to see Smarter Balanced test data for the following student groups:
- All students
- English learners
- Students with disabilities
- Economically disadvantaged students
- Migrant students
- Students by gender
- Students by race/ethnicity
- Students by grade
In cases where there is just a single group of students, e.g.: all students, English learners, students with disabilities, economically disadvantaged students, and migrant students, you can view all four achievement levels in one graph. But when there are multiple student groups (such as race/ethnicity, gender or grade) you have the choice to either view results across all four achievement levels for a single student group, or view results for all student groups in a single achievement level.
For example, you can see what percentage of students in a single grade performed at each achievement level:

Or, you can see data for all grades at a single performance level. Choices of performance level include:
- Level 4 - standard exceeded
- Level 3 - standard met
- Level 2 - standard nearly met
- Level 1 - standard not met
- Levels 3 & 4, this combination of two levels indicates the percent of students who met or exceeded the state's standards

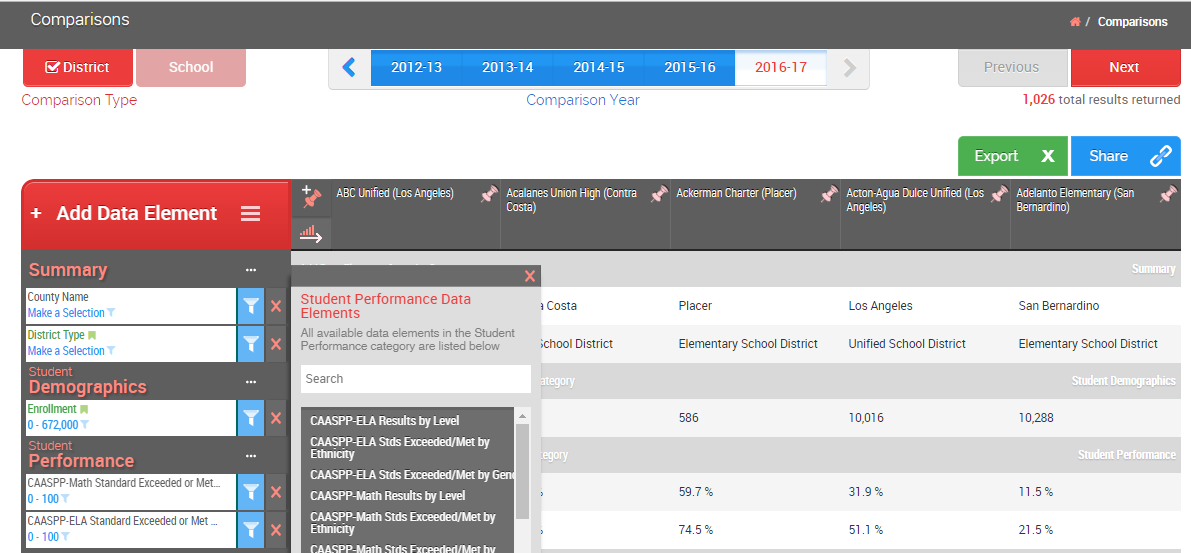
How to view CAASPP data in Comparisons
Ed-Data's powerful comparison tools allow you to view data for multiple schools or school districts in one place. You can now view CAASPP English language arts/literacy and math results in the school and district comparisons.
The default data element for CAASPP in the comparisons is the percent of students meeting or exceeding standards. But you can also view data for different student groups (e.g. race/ethnicity, gender, disadvantaged students) or the percent of students at each level. Click the ... next to Student Performance in the left column to see and add additional data elements. Use the "Comparison Year" slider at the to change the year of the data. CAASPP data are available in comparisons, beginning with the 2014-15 school year, the first year the tests were administered in California.
For more detailed instructions on using the comparison tools, please see, How to Create District or School Comparisons.
About the CAASPP Smarter Balanced Tests
In 2014, California introduced a new assessment system, aligned to the Common Core State Standards. Known as the California Assessment of Student Performance and Progress, or CAASPP, this system includes tests for mathematics and English language arts /literacy, which are also referred to as the Smarter Balanced assessments.
The new Smarter Balanced tests were first administered in 2015 to students in grades 3 - 8 and 11 and are administered each spring to all students except those whose Individualized Education Plan (IEP) requires the student take an alternative assessment, those whose parents opt out, and to English learners who are in their first 12 months of attending a school in the United States.
Unlike the pencil-and-paper tests under California’s former Standardized Testing and Reporting (STAR) system, the CAASPP Smarter Balanced tests are taken on a computer and are adaptive. This means the test will become more or less difficult depending on whether a student answers the previous question correctly or incorrectly. If a student answers incorrectly, or doesn’t answer a question, the next question will be less difficult.
While the previous California tests contained only multiple-choice questions, some of the Smarter Balanced test questions require students to briefly explain their thinking about how they got their answers. Questions are intended to measure a student’s problem-solving and critical thinking skills.
Students receive an overall “scale” score somewhere between 2114 and 2795 for English language arts/literacy and between 2189 and 2862 in math. (Score ranges vary slightly based on grade level.) These scale scores fall into one of four achievement levels: standard exceeded, standard met, standard nearly met, and standard not met.
What the achievement levels signify
Level 4: Standard exceeded - the student has surpassed the achievement standard and demonstrates advanced progress toward mastering the skills and knowledge necessary to succeed in future coursework. In grades 6-8 and 11, this achievement level also indicates that a student has demonstrated advanced progress toward college readiness after graduation.
Level 3: Standard met - the student has made progress and met the achievement standard for his/her grade level. The student appears ready for future coursework. In grades 6-8 and 11, this achievement level indicates that the student is on track toward mastering skills and knowledge needed to be ready for college after graduation.
Level 2: Standard nearly met - the student is close to meeting the achievement standard and may need further development to demonstrate skills and knowledge required for future coursework. In grades 6-8 and 11, a score in this range indicates further development may be needed to succeed in entry-level college courses after graduation.
Level 1: Standard not met - the student did not meet the grade-level achievement standard and must improve substantially to demonstrate the skills and knowledge needed to succeed in future coursework. In grades 6-8 and 11, a score in this range indicates the student needs to improve substantially to be ready for college after graduation.
Students who do not answer a minimum number questions in each subject area of the tests receive the minimum scores possible. Performance on the Smarter Balanced tests does not affect the student's grade in school. Test results for individual students are only available to parents/guardians and can be obtained from the school or school district.
More information
If you would like to be informed when we add data or functionality to Ed-Data, please join our email list using the Subscribe option on the lower right corner of any page.
For more information about California's new testing system, please see the links in the Learn More section above.
Click here to go to the state-level CAASPP graphs on Ed-Data. From there you can navigate to the county, district, or school of your choice.