What's new:
2022-23 Graduation/dropouts rates and A-G data
Visit the student profile at the school, district, county or state level for detailed data on the count and percentage of students who graduated with their 4-year cohort or dropped out, and how many of those students completed the a-g course requirements for admission into the University of California and California State University systems. You drill in to view the data by student group or whether the student is enrolled in a charter or traditional district school. You can also include these data in your school and district comparisons.
2022-23 CAASPP/Smarter Balanced test results
See how students performed on the state's standardized tests in your school or district or at the county and state level. You can view the data by student group or grade. These data are also available in the school and district comparisons.
2022-23 Chronic absenteeism
The number of students chronically absent, which is defined as missing 10% or more of the school year, has risen sharply since the pandemic. You can view the five-year trends in the number of students chronically absent for a school, district, county or the state as a whole. You can also drill into the graphs to view data for student groups including homeless students, English learners, or by race/ethnicity or grade.
2022-23 Discipline data
Ed-Data's 5-year trend graphs show you whether the rate of students suspended or expelled are increasing or going down, the most serious offenses for which students were disciplined, and the rate of students disciplined for "defiance" only. Data are available at the school, district, county and state level.
2022-23 Cumulative enrollment
Cumulative enrollment counts are collected at the end of the school year and used in the calculations for discipline and chronic absenteeism rates. These data also include additional student groups, such as homeless and migrant students, foster youth, students with disabilities and socieconomically disadvantaged students that are not currently included in the the available Census Day Enrollment data.
2022-23 Average teacher salary data
Visit the staff tab for data on average teacher salaries and the salary schedules for school districts as well as the statewide data.
Also available:
2022-23 Census Day enrollment data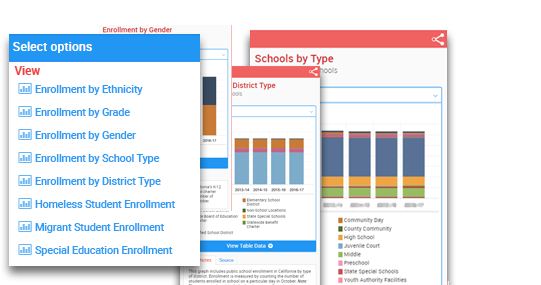
Visit the student profile at the school, district, county or state level for detailed demographic data including enrollment by race/ethnicity, gender, grade, school type and more.
In the state-level student profile, you can also find data on the number of students eligible for free and reduced-price meals (used as a proxy for poverty) and the number of English learners. Also in this section is the "unduplicated pupil count" of high-needs students, which serves as a starting point for calculating funding under the state's Local Control Funding Formula.
In the summary section at the top of every profile page, you will find information about the school or district including contacts, location and more. The student profile data elements are also available in school and district comparisons.
A couple of things to keep in mind when you look at these data:
- Data for students redesignated as proficient in English (RFEP) or designated fluent English proficient (FEP) are now part of the end-of-year data collection. We are awaiting the new RFEP reports from the state for 2021-22 and 2022-23.
- Enrollments for students with disabilities, homeless and migrant students are not currently available in the public downloadable data files, so are missing from the Census-Day Enrollment graphs.
School district bond and parcel tax election results
California's public school districts have three widely used options for requesting support from local taxpayers: elections for general obligation bonds, special facility elections, and parcel tax elections. Under the Local Revenue Elections tab at the district level, you can see the outcomes of any of these measures the district may have placed on the ballot. Go to local revenue elections at the state level here or learn more about them here.
Have you tried the comparison tools?
Much of the data mentioned above are also available in our school and district comparisons. Our comparison functionality allows you to:
- Compare schools or districts
- Select a specific year for comparisons and toggle between years as desired
- Select the data elements to be included in the comparison results from a list of all fields or by data category (e.g., summary, student demographic, performance, suspensions/expulsions, finance)
- Add in corresponding state or county data for elements you’ve added
- Filter results using criteria you select (e.g., show districts matching a specific data range such as enrollment between 1-500 students, or show only districts or schools within specific counties)
- Sort each data element from high to low or low to high, or sort districts/schools alphabetically
- Add specific schools or districts into the comparison (e.g., add a high-performing district or a neighboring district or school regardless of the other selection criteria used)
- Export results to Excel
- Eliminate a data element from results if you don’t need it
- “Pin” one or more districts or schools so that they are always displayed in the left-most columns of the results regardless of any sorting performed by the user – allowing you to compare districts/schools of interest with the highest or lowest values in each field
For a step-by-step “how to” directions on using the comparisons, view one of our online tutorials or see our How to Create District or School Comparisons article. Or start making your own comparisons: Compare Schools or Compare Districts.
What's Next
School district financial reports and Census Day enrollment data are expected in March.
To receive notifications when new data are added to the site, please subscribe to updates using the form provided in the site’s footer:
Contact us
Let us know what you like and what we can do better by using the Contact box in the bottom right corner of any page. Or email us.